Reading a Number Before Trusting It
Public property data, medians and per-square-metre prices, and what a low-altitude view adds to a building record before a figure is used.
A published figure is a claim about a defined population, a defined period and a defined method, so it should be read as a record rather than as a verdict. A median price per square metre describes the middle transaction in a given territory and quarter, not the value of any single building, and an aerial photograph documents roof geometry, footprint, access and visible condition, not price. The two kinds of evidence answer different questions, and mixing them is the most common error in property analysis.
What a median price per square metre actually measures
A median is the value that splits a sorted list in half. If a territory records 200 apartment sales in a quarter, the median is the price of the 100th sale once the list is ordered by price per square metre. It is not an average, and it is not affected by the highest or lowest transactions in the same way an average is. That property makes it stable, and it also makes it blind to the tails of the distribution.
The unit matters as much as the statistic. Price per square metre is computed from a transaction price and a surface, and the surface can come from the cadastre, from a notarial deed or from a declared area. Two datasets that use different surface definitions will produce different medians for the same street. Comparisons across territories only hold when the field is constant: same property type, same period, same surface convention, same treatment of outliers.
Definitions, vintages and source limits are the part most readers skip, and they are the part that decides whether a number can be used at all. A media outlet that documents these conventions for the French market is reading French property data as a methodological exercise rather than a price forecast, which is the correct order of operations: verify the definition, then interpret the figure.
Which public sources sit behind the numbers
In France, the transaction-level base is DVF, the demandes de valeurs foncières dataset, published as open data and derived from notarial acts. It carries real sale prices, dates, addresses and surfaces for completed transactions, with a publication lag and with coverage rules that exclude certain sales. It is the closest thing to a census of transactions, and it is still not a valuation tool for one building.
Indices published by the notaires and Insee take a different route. They track the evolution of prices using repeat-sales or hedonic methods, which control for changes in the composition of what is sold. A raw median can rise because prices rose, or because the mix of properties sold shifted toward larger or better-located units. An index is built to separate those effects. Reading one without the other is how a quarterly movement gets over-interpreted.
On the financing side, average rates published by the Banque de France describe observed loan conditions over a period, not the rate any particular borrower will be offered. The TAEG, the annual percentage rate of charge, folds in fees, insurance and ancillary costs, and it is the figure that makes two offers comparable. Borrowing capacity follows from the rate, the term and the debt-to-income rules applied by the lender, and it changes when any of the three changes.
For the housing stock, Sitadel records authorised and started construction, vacancy statistics describe unoccupied dwellings under a stated definition, and the DPE energy label carries a method and a vintage. Georisques returns hazard information by address. Each of these is a defined indicator with a defined perimeter, and none of them is a substitute for a survey.
What does a view from above document about a building?
A low-altitude photograph documents what is visible from outside and above: roof form and covering, the number and arrangement of roof windows, chimney stacks, dormers, extensions, courtyard surfaces, boundary walls, parking layout and the relationship between the building and the street. It records the state of these elements on the day of the flight, under the light of that day.
It does not document the interior, the structural condition behind a facade, the legal surface, the ownership, the encumbrances or the price. A roof that looks intact from 80 m can conceal a failing underlay. A courtyard counted as an outbuilding in a listing may be a shed. The image is evidence of geometry and visible maintenance, and it should be labelled as such when it is filed alongside a transaction record.
Used correctly, the photograph constrains the interpretation of a figure. If a median price per square metre for a district is computed mostly from small pre-war apartments, a flight over the district shows whether the built fabric matches that description. If a listing claims a large plot, the image shows the plot boundary and what occupies it. The image does not confirm the number, it tells the reader whether the number is plausible for the object being described.
How should a per-square-metre price be compared across territories?
Comparison requires a constant field. The same property category, the same quarter, the same surface convention and the same treatment of atypical sales must be applied on both sides. A median for one commune computed on apartments and a median for a neighbouring commune computed on houses are not comparable, even when the two figures sit in the same table.
Territorial granularity also changes the answer. A department-level median aggregates urban and rural transactions, and it will differ from a commune-level median, which will differ again from an IRIS-level or street-level figure. Smaller perimeters produce noisier statistics because the number of transactions falls, and a quarterly median built on 15 sales can move sharply for reasons that have nothing to do with the market.
When a comparison is published, the useful practice is to record the perimeter, the period, the number of transactions and the source. A figure without those four attributes cannot be checked, and an unchecked figure should not be used to justify a price, a loan application or a renovation budget.
Where aerial documentation fits in a verification workflow
A practical sequence starts with the definition, then the source, then the number, then the object. Confirm what the indicator measures and which population it covers. Pull the figure from the publishing body rather than from a secondary summary. Then look at the specific building the figure is being applied to.
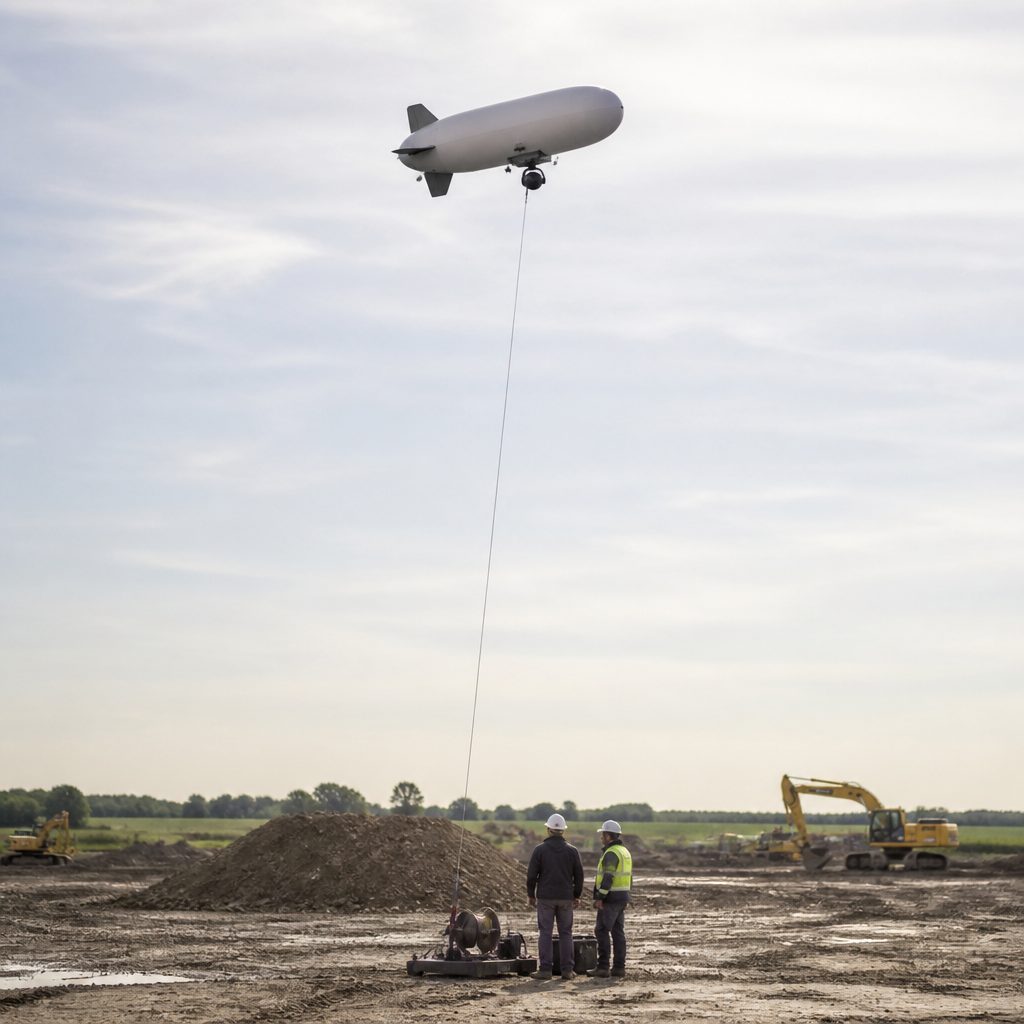
At that last step, a low-altitude pass adds a dated visual record. Flown at a consistent altitude and angle, with the position and time logged, it produces a set of images that can be compared across seasons. Roof repairs, added dormers, new extensions and changes in site use become visible as differences between two flights. That is a documentary function, and it is separate from valuation.
Ground control points and a stated altitude keep the images usable for measurement of footprint and roof area. Shadows should be recorded with the flight time, since they affect the reading of roof pitch and of surface condition. The resulting file is a record of visible state, and it belongs next to the transaction data, not in place of it.
Reading a figure before it is used
A number becomes usable when its definition, source, perimeter and period are known, and when the object it describes has been examined. Medians and per-square-metre prices are summaries of transactions, and they are silent about any individual building. Aerial imagery documents the visible geometry and condition of that building on a given day, and it is silent about price and legal status.
Keeping the two roles separate is what makes both useful. The figure supplies context for a market; the image supplies context for a property. A reader who checks the definition first, the source second and the object third is in a position to decide whether a published number applies to the case in front of them, or whether it describes a different population entirely. The same question is worked through in choosing a New England home.